QMAN — application for monitoring and managing QHB instances
WARNING!
In QHB 1.5.3 release, this feature is experimental and is not recommended for use in a production installation.
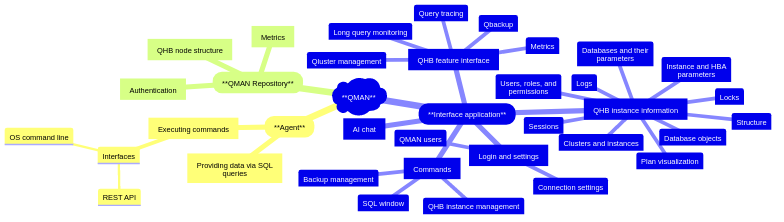
The QMAN (QHB Manager) interface application is designed for monitoring and managing instances and clusters QHB. It includes an interface module, a QMAN agent, a REST/SQL API, a central repository, and scripts for executing queries and commands.
Description
QMAN provides a current state snapshot of individual QHB servers and clusters and centralized data storage in a single repository based on QHB. The administrator defines the structure of instances and clusters and connection parameters, and then the system periodically updates metrics and technical information through an agent. Data updates are performed independently of the interface, ensuring their relevance even if the UI is temporarily unavailable. An agent installed on each host running QHB accepts command queries from the interface and provides data from installed QHB instances. Results (metrics, statuses, events) are written to the QMAN repository. The following QHB operating modes are supported: single instances outside a cluster, clusters managed by Qluster, clusters without a manager (manual management/scripts).
Note
We also plan to manage Patroni clusters adapted for QHB (for now, only the structure and status of instances are displayed).
Components
- QHB instances (single and cluster installations).
- QMAN agents on hosts running QHB.
- QMAN central repository (monitoring and management database).
- QMAN interface application.
QMAN Component Relationship Diagram
Installing Components
Central Repository
The central repository is installed on the server that is selected as the central server accessed for authorization and data queries about instances in interface applications, where monitoring is configured using QMAN and metric data from other hosts is collected, and where the ability of QMAN agents to execute commands when accessed from the interface application is verified. The scripts are supplied with the QMAN agent (qman-backend) in a single package, located in a separate subdirectory repo_scripts and run using psql.
Interface Application
The qman-client module (a GUI application) is supplied in a separate package and is a binary executable file called qman. Application settings are stored in the qman_config.toml configuration file.
QMAN Agent
The QMAN agent is installed on the target Linux system. The recommended installation directory is /opt/qman-backend (owner root, permissions 755).
- Download the qman-backend binary for the target Linux OS.
- In the installation directory (/opt/qman-backend), place:
- qman-backend binary file;
- config.yml configuration (see example);
- data subdirectory with command preset files and scripts (copied from the qman-backend repository);
- presets.yml and validators.yml files.
Configuration Examples
config.yml (агент QMAN):
msg_db_file: "internal_msg.dat"
repo_conn_str: "host=192.168.110.44 dbname=qman user=qman"
internal_msg_config:
  repository_agent_url: "http://192.168.110.44:3000/internal-msg"
  send_timeout_sec: 12
  send_retry_count: 12
  msg_process_pause_sec: 12
Registering the qman-agent Service in systemd
Create the /etc/systemd/system/qman-agent.service service file:
[Unit]
Description=Qman Agent
After=syslog.target
After=network.target

[Service]
WorkingDirectory=/opt/qman-backend
User=qhb
Group=qhb
ExecStart=/opt/qman-backend/qman-backend
Restart=always

[Install]
WantedBy=multi-user.target
Then execute:
systemctl enable qman-agent
systemctl start qman-agent
systemctl status qman-agent
API
The QMAN agent is installed on each host where QHB needs to be managed, including the host with the central repository database, communication with which in the QMAN application also occurs via agent commands. By specifying the location of the central repository in the settings, agents know it. There is a mechanism for transmitting messages (including deferred ones, in the event of a connection failure) to the central repository through agent calls.
The agent can execute three types of commands:
- Operating system commands.
- SQL queries.
- Requests via the REST interface.
Commands are described in so-called presets—command templates that contain the actual commands and code sections for parameter substitution, enclosed in double curly braces. Presets are located in the corresponding subdirectories of the /opt/qman-backend/data/tpl directory. A list of all preset commands is contained in the file /opt/qman-backend/presets.yml, and the file /opt/qman-backend/validators.yml describes the mandatory parameters required to execute the commands. If required parameters are omitted, the command will not be executed.
The Patroni cluster can be monitored via the Patroni REST interface (for more information, see the Patroni documentation). Parameters for accessing Patroni via the REST interface are stored in the QMAN repository data.
QMAN Interface Application
Settings (Address and Port of the Central Repository Host, Interface Settings)
In the qman_config.toml file, you need to specify the central repository host address, the agent port (3000), the username, and the password.
Creating a Database and Users to Log in QMAN
On the QHB instance for the central repository and on each QHB instance accessible to QMAN, you must create a user qman and a service database qman. In the central repository, when installing repository objects from the scripts supplied with the QMAN agent, the qman user, qman database, and qman_user role are created automatically. For instances registered in QMAN, you must manually run the following script as the superuser:
-- qman database and qman user
CREATE DATABASE qman;
CREATE USER qman WITH superuser login;
GRANT all ON database qman TO qman;
From now on, all operations through the QMAN agent on the managed instances will be performed as the qman service user. Operations as the qman user must be performed only through the QMAN agent, connecting only via Unix domain sockets (connection type local in qhb_hba.conf). Operations as the qman user over the network must not be possible.
User roles are created for each real user. Passwords must be set for logging into the QMAN application. Each real QMAN user must be assigned the qman_user role. Without this role, the user will not be able to log into the application. To do this, you need to execute
GRANT qman_user TO <new_user>;
for the each new QMAN user.
User Login and Authentication
When logging into QMAN, the user enters the username and password. A connection is established to the repository and the presence of the qman_user role is checked. If the user has such a role, they receive a so-called "ticket," and all subsequent actions are performed using this "ticket," which is used to verify the user's access to QMAN. If the user has not performed any operations for more than an hour, they must log in again.
Figure 1. Login Window
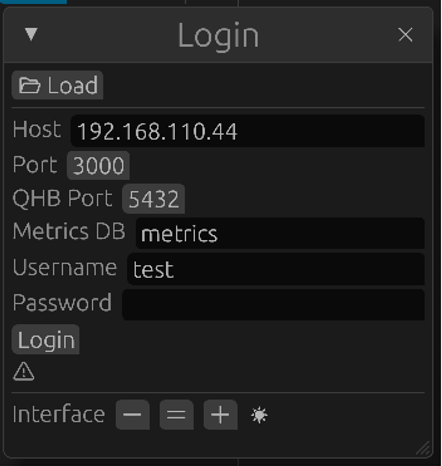
Login settings can be saved in the qman_config.toml file in the same directory as the binary.
Object Tree Structure. Object Modification Operations
The interface displays a hierarchical tree of QHB instances, grouped into logical partitions or groups (e.g., enterprise divisions). Instances can be either single or grouped into clusters, including a master instance and replicas. The following entities are supported: group, host, cluster, and QHB instance.
Representation of Instances by Host and by Cluster
Physical Representation
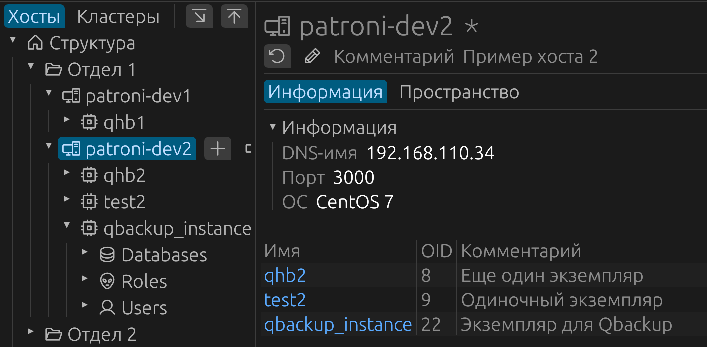
Instances in this case are represented by a list for each individual host:
Figure 2. Instances by Host
The object tree can be switched to this mode using the “Hosts” button.
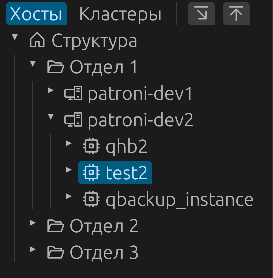
Logical Representation
In this case, instances are represented as lists within groups for each cluster:
Figure 3. Instances by Cluster
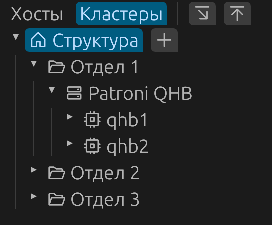
The object tree can be switched to this mode using the “Clusters” button.
Switching between instance representations allows you to analyze your infrastructure by host or cluster. When switching between representations, the selected instance remains in focus, allowing you to determine which cluster the selected instance is running in or which host it is deployed on. Integration with Qluster clusters is supported, as well as displaying the structure and state of Patroni cluster nodes.
Navigating the Element Tree
When navigating to a section or host, child objects are displayed. For a section, these are hosts; for hosts, these are instances. When following links to screens with data from other objects, the navigation history is saved, allowing the user to go back or return to the previous location again. The navigation buttons work similarly to the buttons used to navigate through viewed pages in browsers.
Tree Elements and Their Management
An object tree node can be fully expanded to show all its child objects up to a level, or collapsed. These are controlled by the corresponding buttons at the top of the object tree panel.
- Each tree element has an internal ID, parent ID, and element type.
- To the right of the tree, a properties panel is displayed with a list of attributes and their values. For each element, a name and comment are displayed.
- Additional characteristics can be defined for each element (stored in an
attribute of type JSON).
- Host attributes: domain name (or IP address), operating system name, QMAN agent port.
- QHB server attributes: name, port, path to the PGDATA data directory, path to the backup directory, current cluster role, metrics usage flag.
- Cluster attributes: management system (Patroni/Qluster).
Operations with tree objects:
- adding an object of a given type;
- editing object data;
- moving an object to another section;
- deleting an object.
Host Information
In addition to the main attributes, hosts also provide information with a list of instances
Figure 4. List of Instances
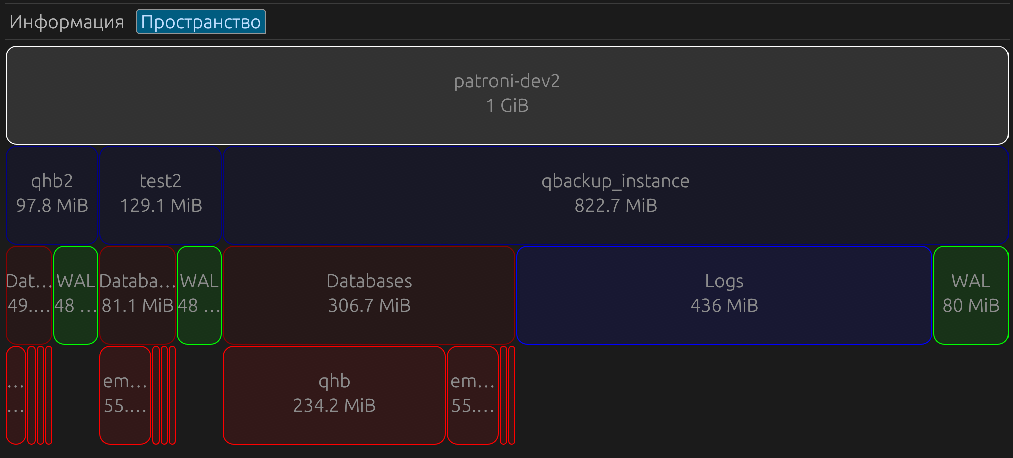
and information about their disk space usage.
Figure 5. Space Distribution
Instance Information
Instance Objects in the Object Tree
The object tree consists of sections-groups (they can correspond to arbitrary structural divisions) that describe physical or virtual hosts, to which, in turn, QHB instances are assigned. The branching depth for groups and the number of objects within groups are unlimited. Hosts can be either within or outside of groups, meaning they can be bound directly to the tree's "root". Instances must be bound to hosts. Each host can have one or more instances bound to it. Instances can also belong to clusters. All operations involving adding or removing tree objects are performed using the tree's control buttons.
Instance Panel
General Information
The "Information" tab contains several sections:
- The name and link to the host on which the instance is deployed, or the name and link to the cluster, if the instance is part of a cluster.
- Data directory and backup directory.
- Instance port.
- Instance role (primary or standby, if it is part of a cluster).
- Metrics usage.
- License information.
- Manage instance start, stop, and restart, as well as reload parameters.
- SQL query window.
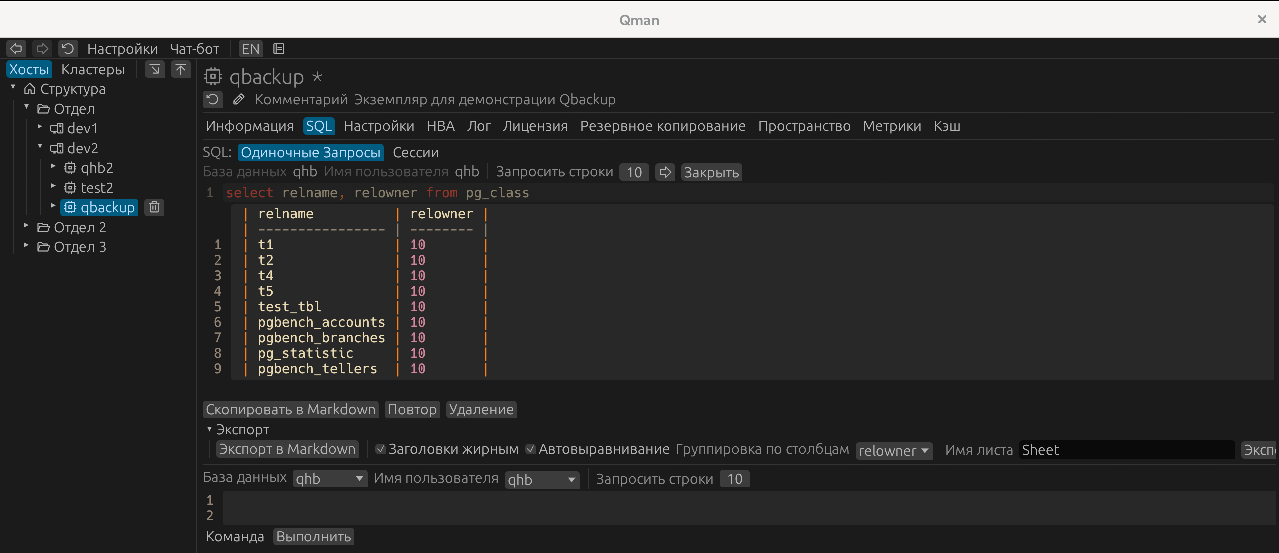
SQL
The SQL tab supports two capabilities: executing single queries or commands, and sessions, where you can open transactions and execute a sequence of related actions, explicitly ending the transactions. By default, the first 10 rows of the query results are selected. To select the next batch of rows, click the corresponding button (with the right arrow). Each query has its own area with query input and data output. If you need to execute a command rather than a query, you must first click the "Command" button. This is a temporary execution order. Query results can be exported in Markdown or XLS format. A special feature of exporting to XLS is the ability to group data into separate sheets by specifying a column in which rows with the same value will be taken for each Excel sheet. In this case, the sheet name does not need to be specified, as each sheet will be named according to the value in the column selected for splitting. An export aspect is that the file name must be specified with the .xls suffix.
Figure 6. SQL Window
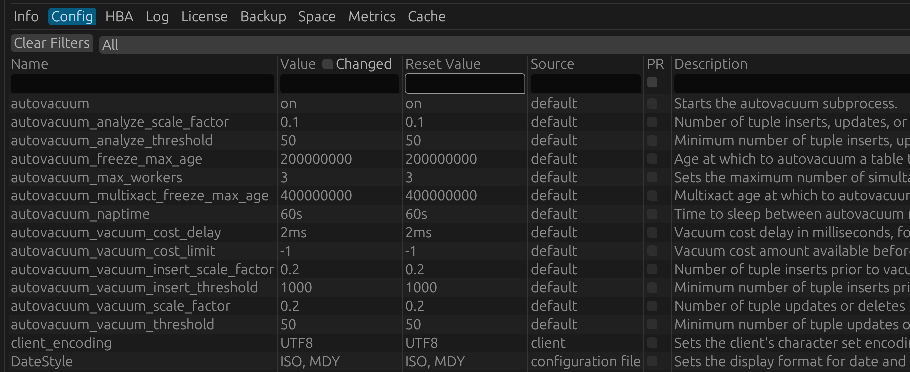
Settings
A complete list of settings is displayed, along with their values, comments, and categories. You can search by section or combination of values for all fields, with search results displayed immediately.
Figure 7. Settings
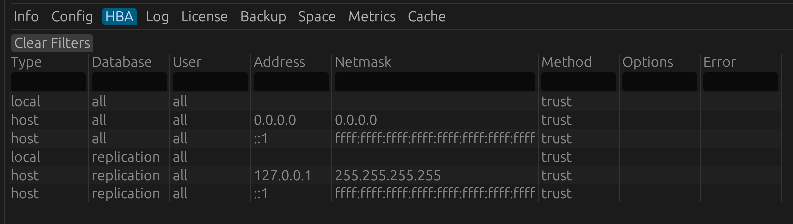
Host-Based Authentication Settings
The data on the HBA tab displays authentication settings based on the data in the qhb_hba.conf file.
Figure 8. HBA Settings
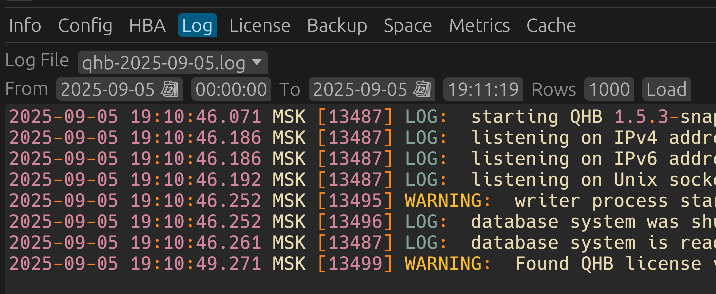
QHB Logs
This tab allows you to select a log file from the list of files in the log directory and set a time period for data output. You can also limit the number of lines output within this period, for example, if there are too many.
Figure 9. Logs
Backup Using the QBackup Utility
To perform a backup, select the "Backup" tab in the instance panel. The "Settings" section contains the main parameters related to configuring backups.
Figure 10. Setting List
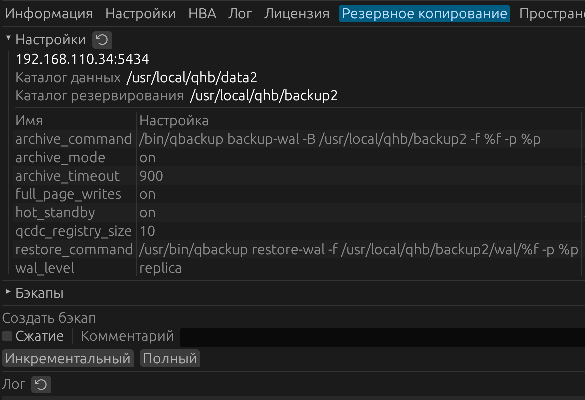
The instance host and port, data directory, and backup directory are specified. Next comes a list of settings that affect backup execution. Continuous WAL backup mode is enabled via the archive_mode parameter. The archive_command and restore_command commands for saving and restoring WAL files must also be defined. Forced switching of WAL files after a timeout occurs when using the archive_timeout parameter. To perform incremental backups, it is necessary to set a value for the qcdc_registry_size parameter, which determines the amount of memory allocated for this purpose. When using streaming archiving mode (which is likely the case in most cases), you need to set the wal_level parameter to replica. When performing backups from the standby server, you need to set hot_standby to on, archive_mode to always, and full_page_writes to on. When setting up backups, carefully review the relevant section of the documentation.
Below is the section with a list of backups, the data for which is taken from the catalog.json file in the backup catalog.
Figure 10. Backup List
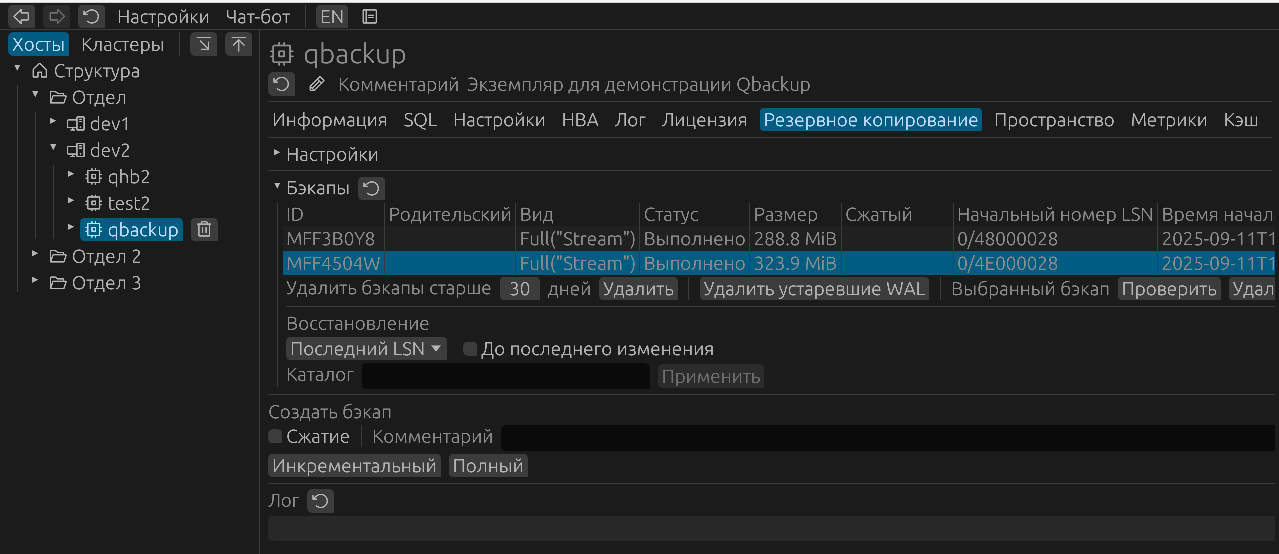
When selecting a specific data backup, you can check its integrity or, if necessary, delete it. Old archives older than a specified number of days, as well as WAL files that are no longer needed, can also be deleted. The corresponding buttons are located immediately after the list of backups. Data can be restored from a backup by specifying the directory to which the restore will be performed and selecting the desired restore mode — to the last change or, if necessary, to a point in time (the syntax for the corresponding parameters of the qbackup utility is provided below as examples):
- at a point in time:
--target-time='2017-05-18 14:18:11+03'; - to transaction number:
--target-xid=687; - to a specific LSN:
--target-lsn=16/B374D848; - to a specified restore point:
--target-name='before_app_upgrade'.
There are controls for creating backups at the bottom of the tab. You can specify whether the backup should be compressed, enter a comment, and select the backup type — full or incremental. Once the backup has started, you can use the "Log" button to refresh the log output and monitor the backup's progress.
Space Occupied
Selecting "Space" on the "Overview" tab displays a diagram of the space distribution between databases, logs, and WAL files.
Figure 12. Space Utilization Diagram
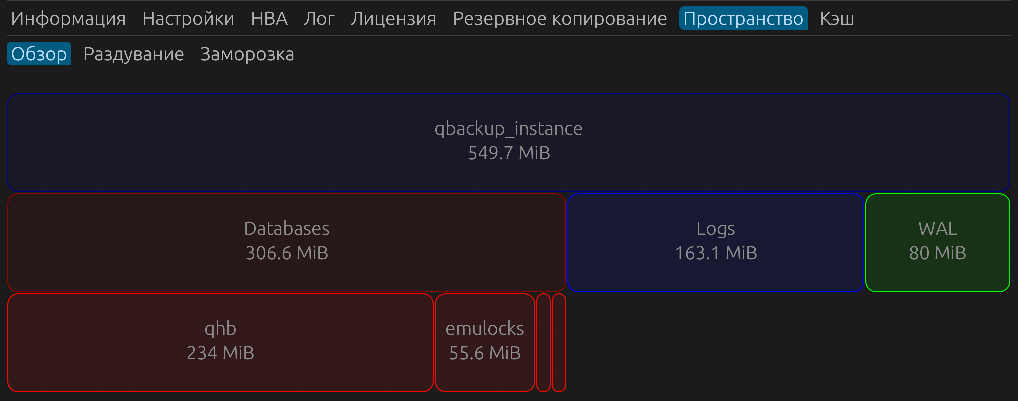
The "Overview" tab contains a diagram with database capacity data.
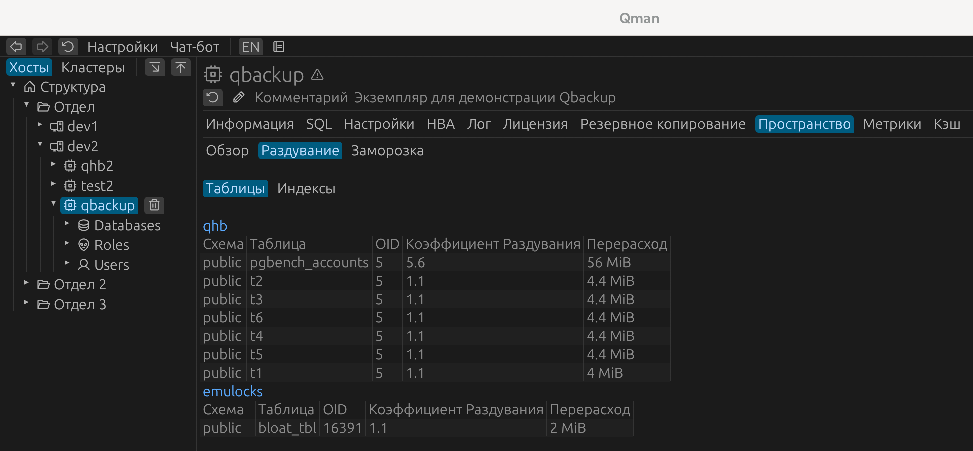
The "Bloat" tab displays table and index bloat data. Its main purpose is to identify the most significant cases of excessive space consumption based on table and index statistics to identify candidates for vacuuming.
Figure 13. Bloating
The "Freeze" tab displays data related to the transaction freezing feature. Under the "Available XIDs of Active Backends" heading, data about the transaction horizon and available transaction IDs for active backend processes is displayed.
Figure 14. Freeze
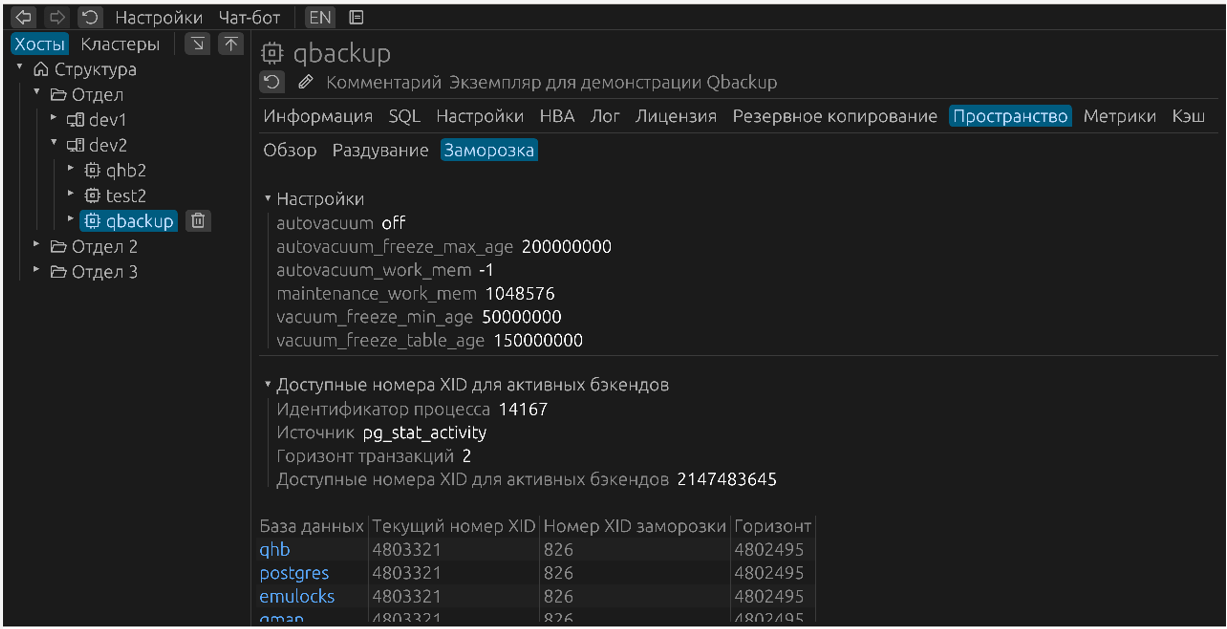
Under the heading "Vacuum Monitoring" data on active vacuuming processes is displayed.
Figure 15. Vacuum Monitoring
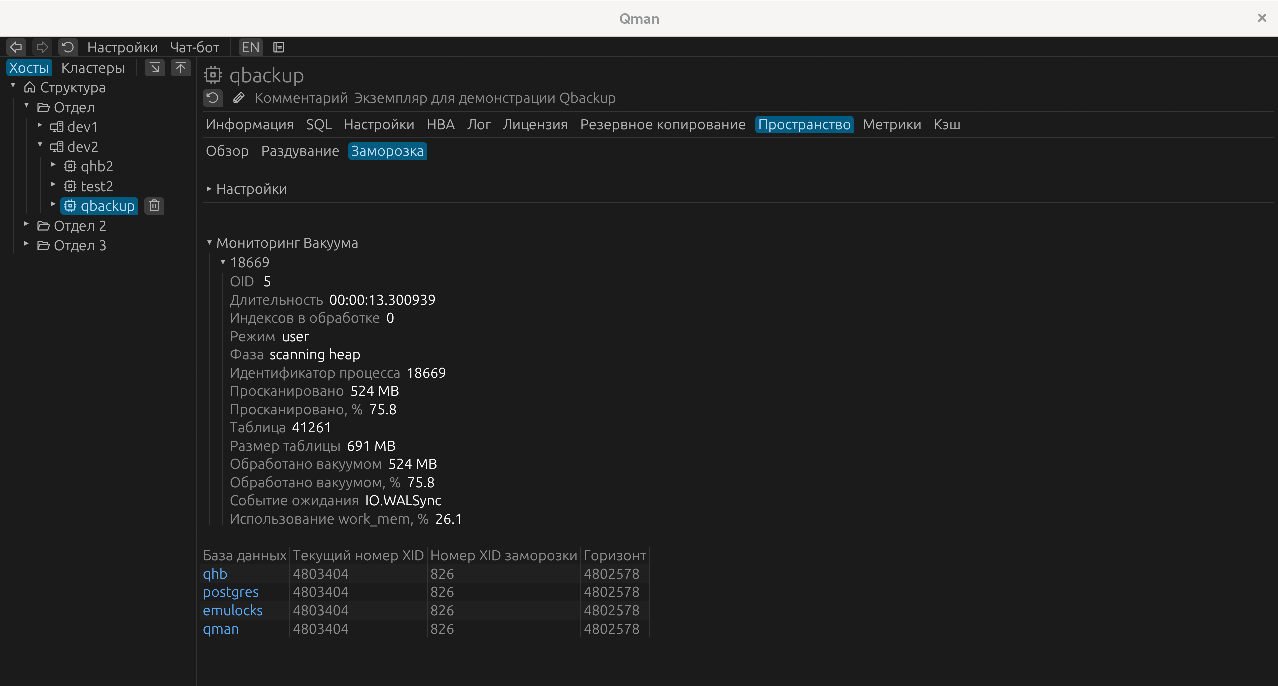
The data block at the bottom of the tab contains statistics on freezes and transactions across the instance's databases.
Metrics
Metrics collection is performed via the metricsd metrics server.
Configuring metrics data upload to the repository's metrics database is done using the qdlm utility. Configuration of metrics collection and metrics data upload are described in the QHB documentation. Сбор метрик осуществляется через сервер метрик metricsd.
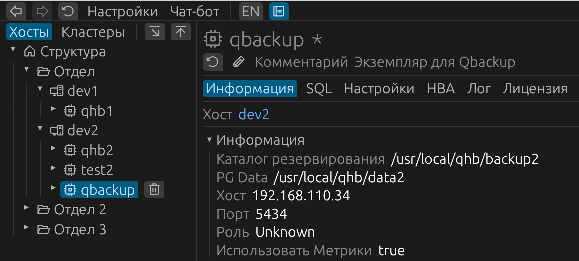
If metrics are collected for this instance, you should mark it accordingly in the "Information" section.
Figure 16. Mark on the Metrics Usage
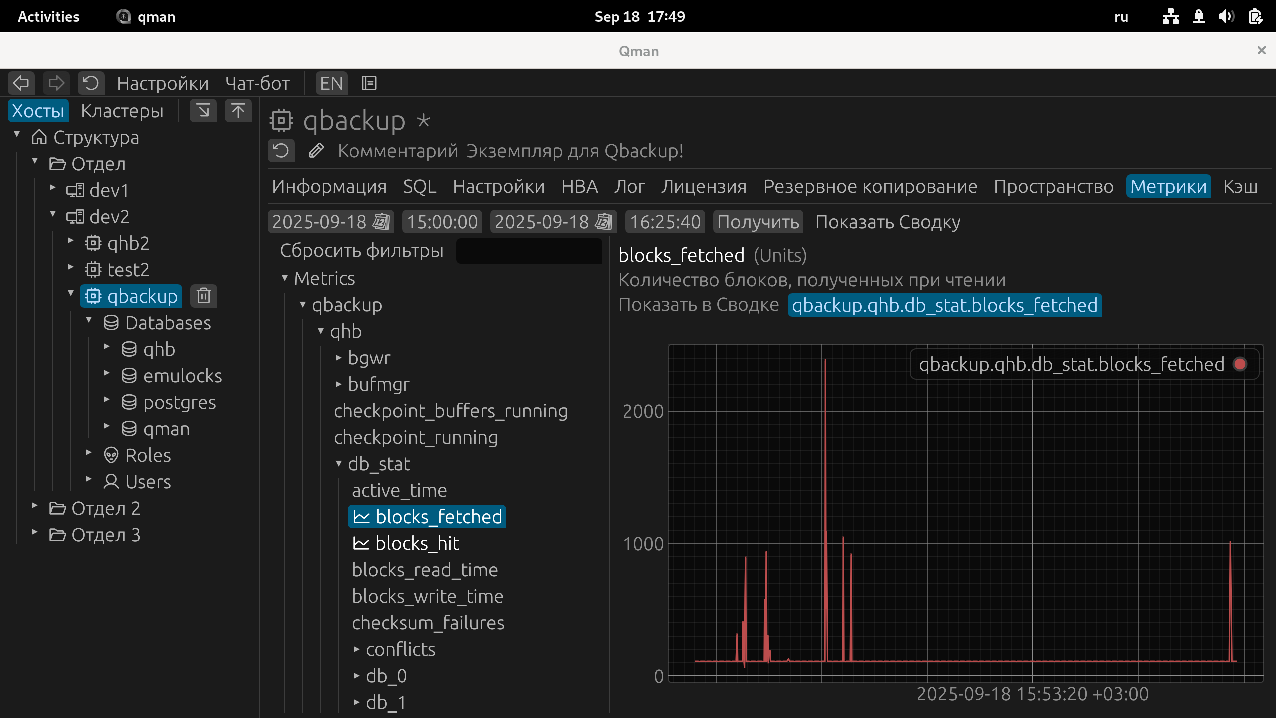
To collect metrics from multiple instances, you must use a prefix at the metrics collector level that matches the instance designation in the object tree. Metrics will be requested from the repository using this prefix. By default, all metrics from the start of the day are requested, and a hierarchical tree with their names is then built. Each part of a metric's name forms a branch, where the leaf elements are the metrics themselves. Over time, metrics are additionally uploaded to the repository, and their composition may expand. Therefore, it makes sense to update the tree's contents with the latest data as needed.
The interface to metrics data is represented by graphs.
The metrics use four main metric classes, broken down by their measurement units: Units, Seconds, Bytes, Percent. Metrics from each class can be displayed in common graphs, combining the corresponding metric classes. To achieve this, measurement units are converted to these four values to ensure data comparability. Of course, you can examine the graph of each metric separately on the main graph, which presents data specifically for the currently selected metric. When you select a metric, it is added to the corresponding area of the summary graph, which is accessible by clicking the "Show Summary" button. Areas with different measurement units can be collapsed and expanded, focusing on the data you need.
For timer type metrics, a split into two metrics is currently used: the metric ending in _count is displayed for the number of events in the Units panel, while the bulk of the metrics are displayed in the Seconds panel, since the remaining values are of a time type. Metrics that are not defined as existing in the Qman metrics directory are also displayed by default in the Units panel.
To view metrics more easily, you can do the following:
- The vertical size of the graph can be changed using the horizontal line at the bottom of the graph, which serves as a control. Using this control, the vertical size can be increased or decreased.
- Scroll the graph left and right -
Shift+Scroll. - Scroll the graph up and down -
Alt+Scroll. - Zoom in and out -
Ctrl+Scroll. - Optimize the graph view - Double-click
- Select a graph area - Right-click and drag to select a rectangular area on the graph.
If you display multiple graphs on a single panel, you can control the visibility of each graph using the circle button to the right of the metric name in the right-hand side of the graph area.
Figure 17. Output of Metrics Graphs
Shared SQL Query Cache
By default, the "Cache" panel displays general statistics for the shared SQL query cache, as well as a list of queries stored in it.
Figure 18. SQL Cache Data
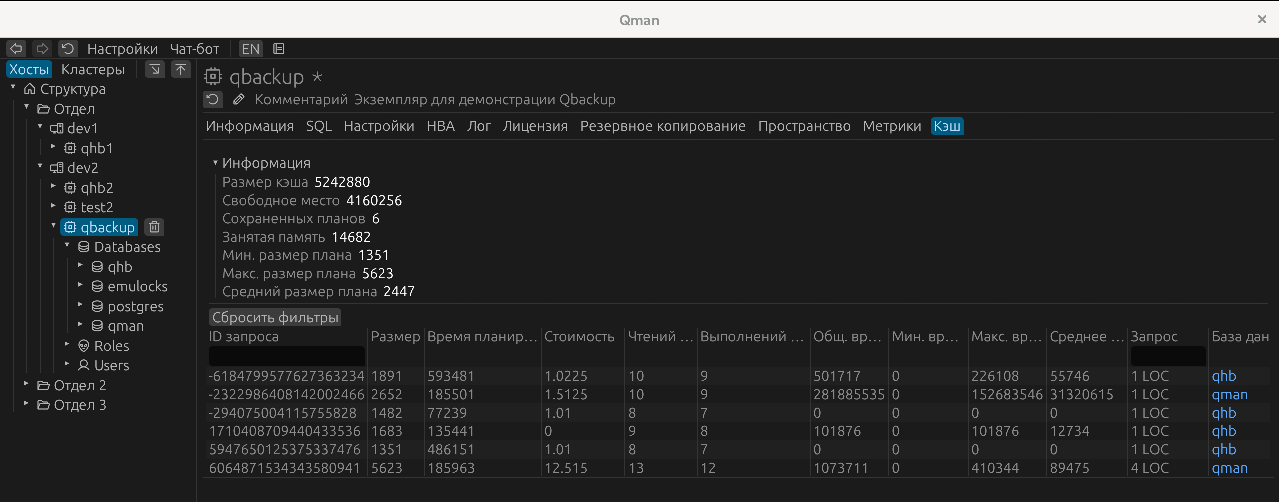
When navigating to a specific query, you can display its text, query plan, and also perform query profiling for a given session.
Figure 19. SQL Queries in Cache
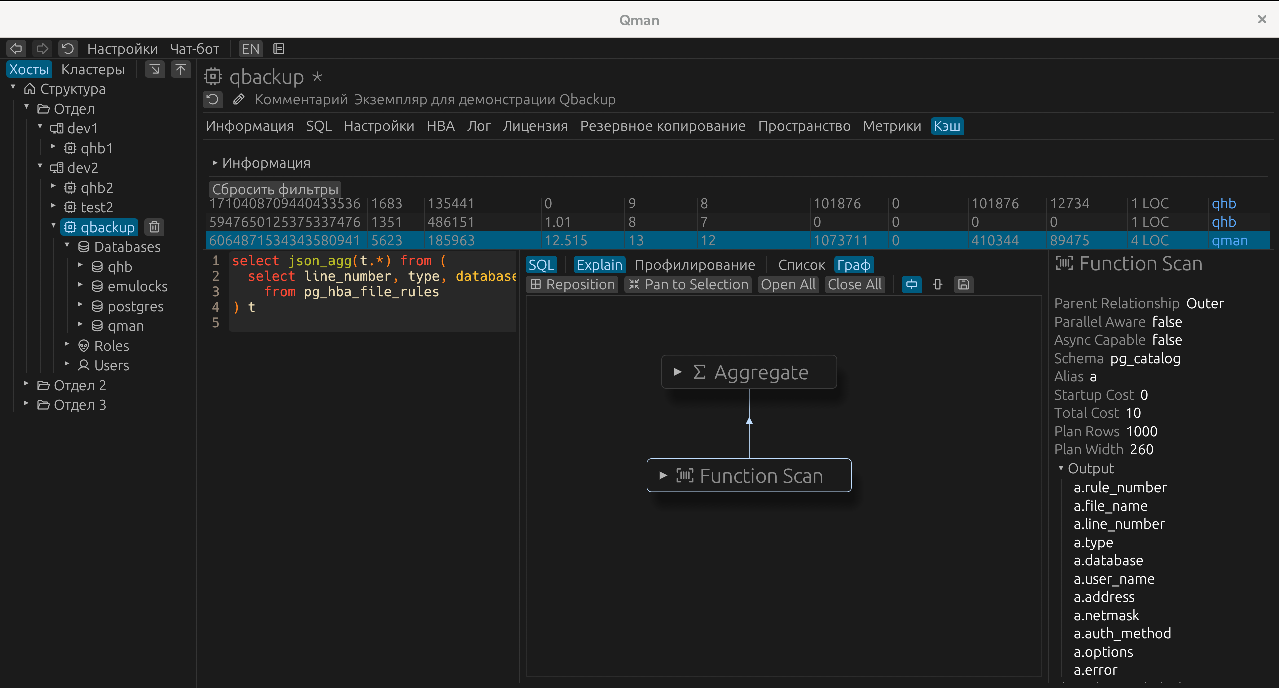
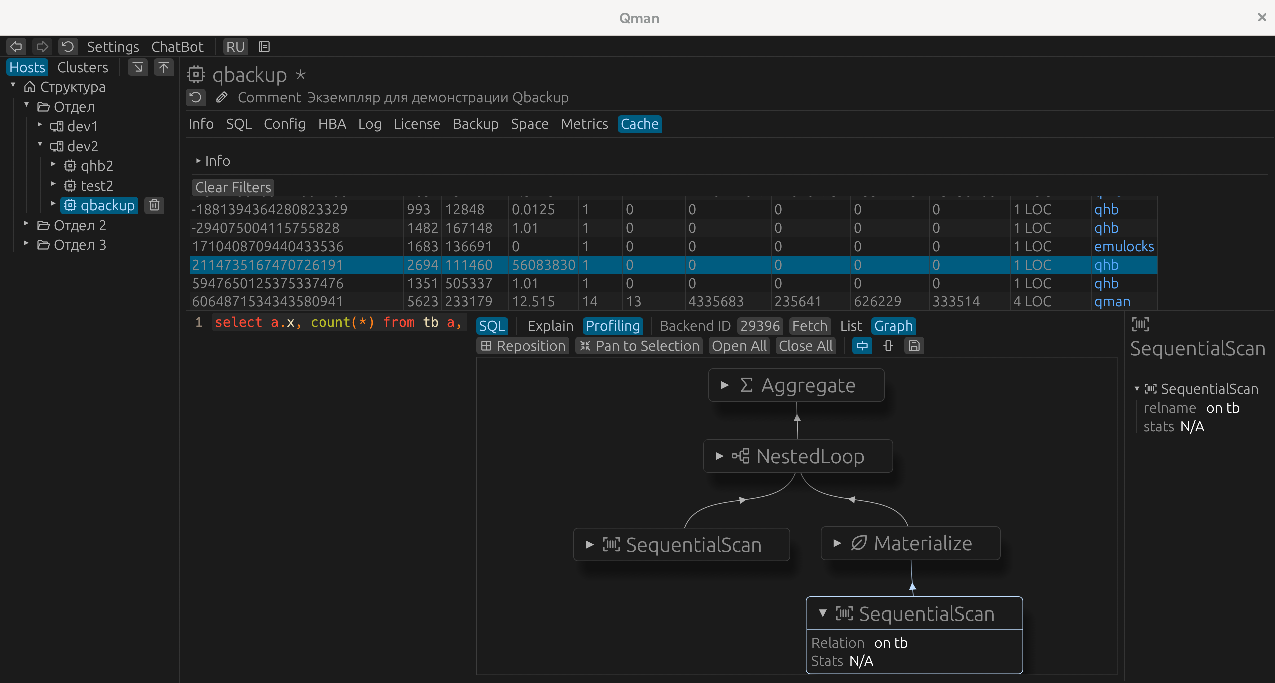
This can be either an administrator session or an application session. When you click the "Profiling" button, you need to type the backend process's PID in the "Backend PID" field and click the "Get" button. When a query is executed in the specified backend, a query plan will appear.
Figure 20. Profiling a SQL Query
Databases and Schemas
When navigating to the "Databases" menu item, a list of the instance's databases is displayed, as well as a diagram of the space occupied by them. Template databases are not included in this list.
Figure 21. List of Instance Databases
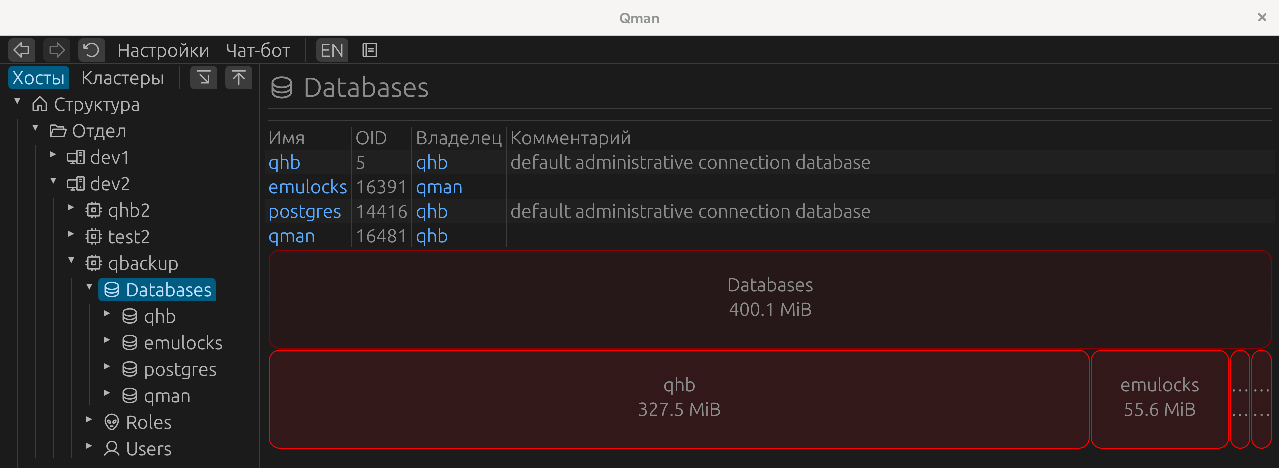
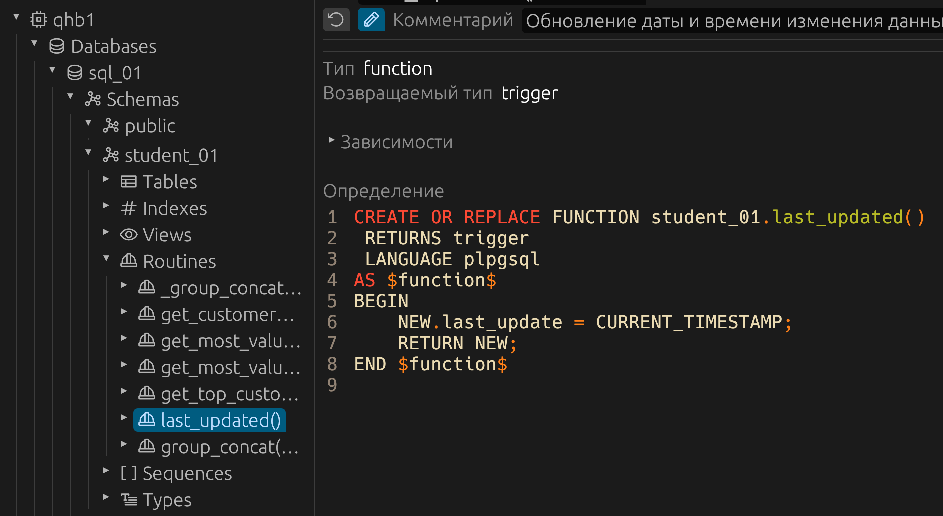
The drop-down list under "Databases" menu item displays a list of existing databases, excluding template databases. When opening a specific database, a list of its existing schemas is displayed, each with a list of objects belonging to it.
Figure 22. Databases and Their Schemas
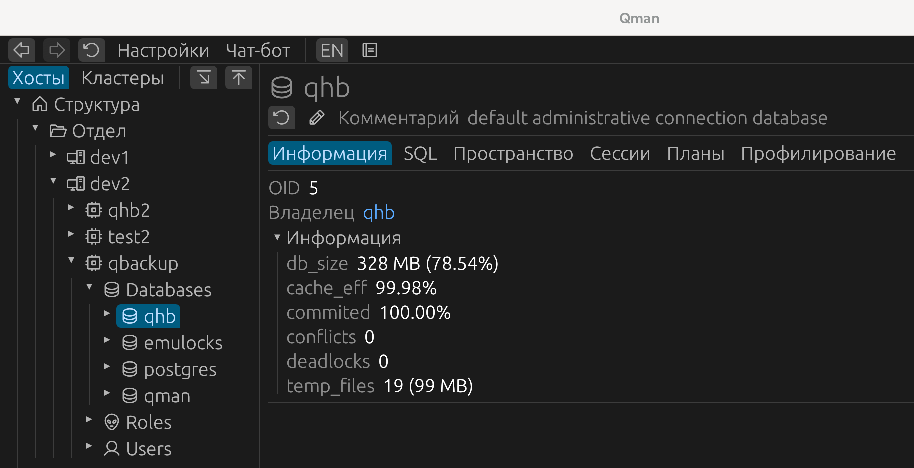
Information
This tab provides general information about the database's performance, including its size, caching efficiency, percentage of committed transactions, number of conflicts and deadlocks, and the number and size of temporary files.
Figure 23. Basic Information About the Functioning of the Database
SQL
The SQL tab replicates the functionality of the instance-level SQL tab. By default, the current database is selected.
Space
The "Overview" tab contains data on the database's capacity.
The "Bloat" tab provides data on table and index bloat, in particular, the amount of space overrun.
The "Freeze" tab contains data on database objects, including freezes, transaction horizons, and the number of vacuum operations for each database table.
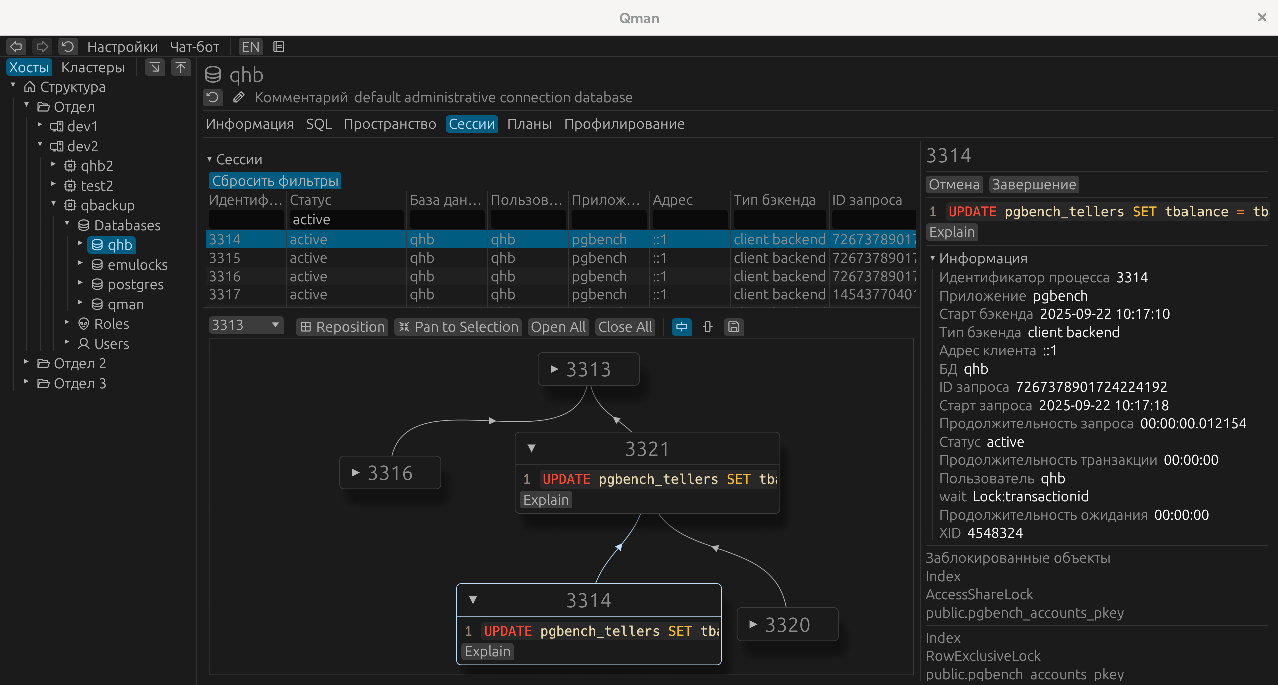
Sessions
The "Sessions" tab lists all sessions related to the selected database. You can
see information about the backend process itself and the query it is executing
(either currently or the last one). A graph of locks is also displayed. In the
right-hand panel you can see query execution details, cancel its execution
("Cancel"), or terminate the session ("End"). If necessary, you can also execute
the EXPLAIN command on the query. This will take you to the "Plans" tab.
Figure 24. Sessions
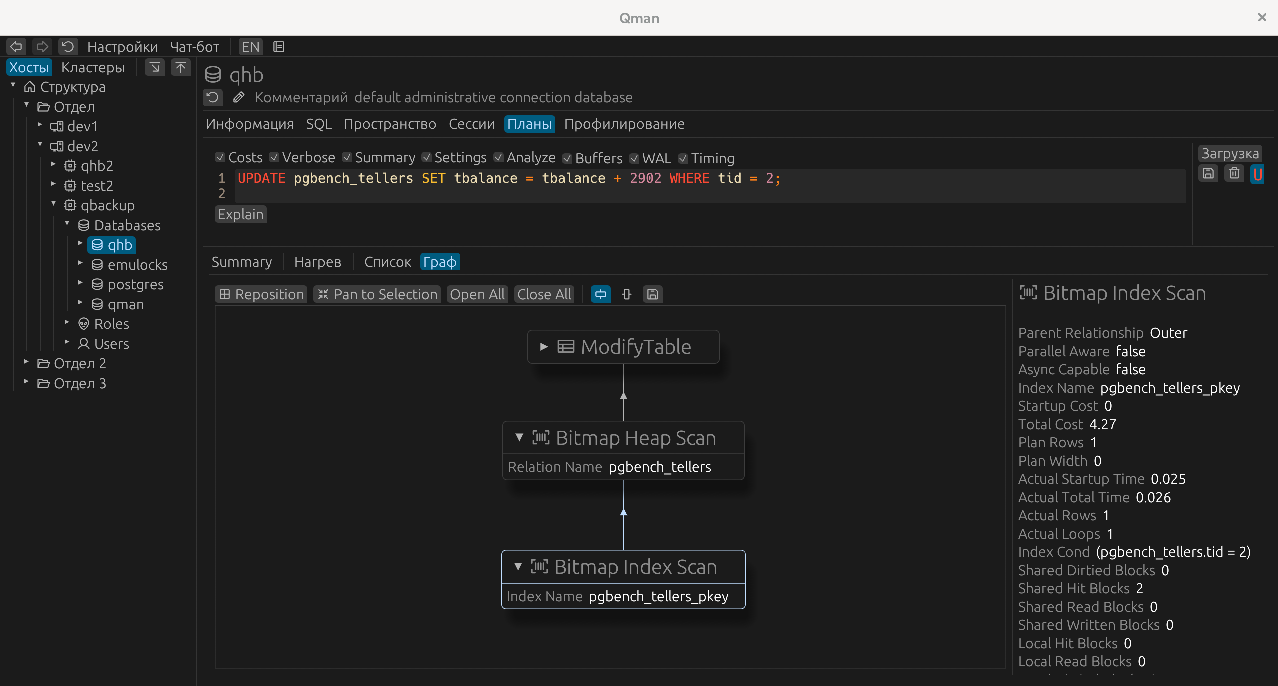
Plans
To analyze query plans, you can execute the EXPLAIN command with all its options.
Figure 25. Plans
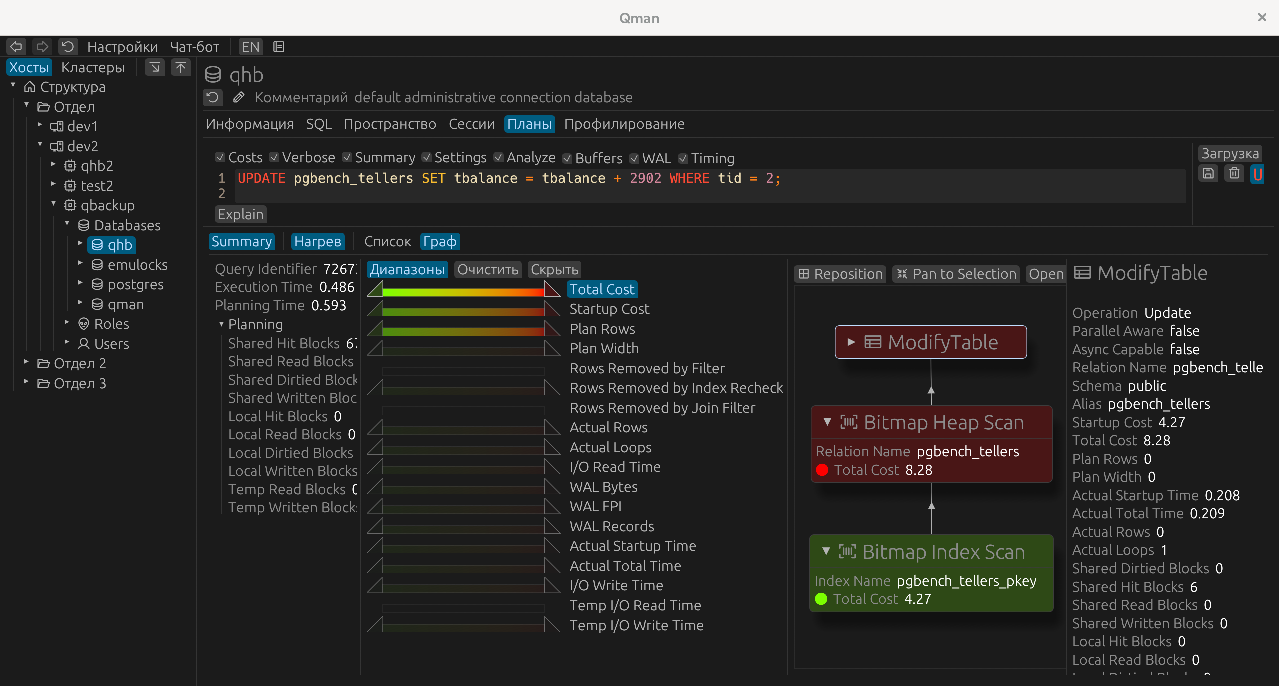
If a more detailed analysis is needed, more detailed information can be obtained. Furthermore, for a more visual presentation of the data, you can use so-called "heating ranges" — temperature scales in which the red end corresponds to the maximum values and the green end to the minimum. By adjusting the boundaries of the "red" and "green" ends of the scale, you can flexibly designate temperature levels for only the ranges of value of interest for analysis, assigning them to the red or green zones.
Figure 26. Plans. Advanced Analysis
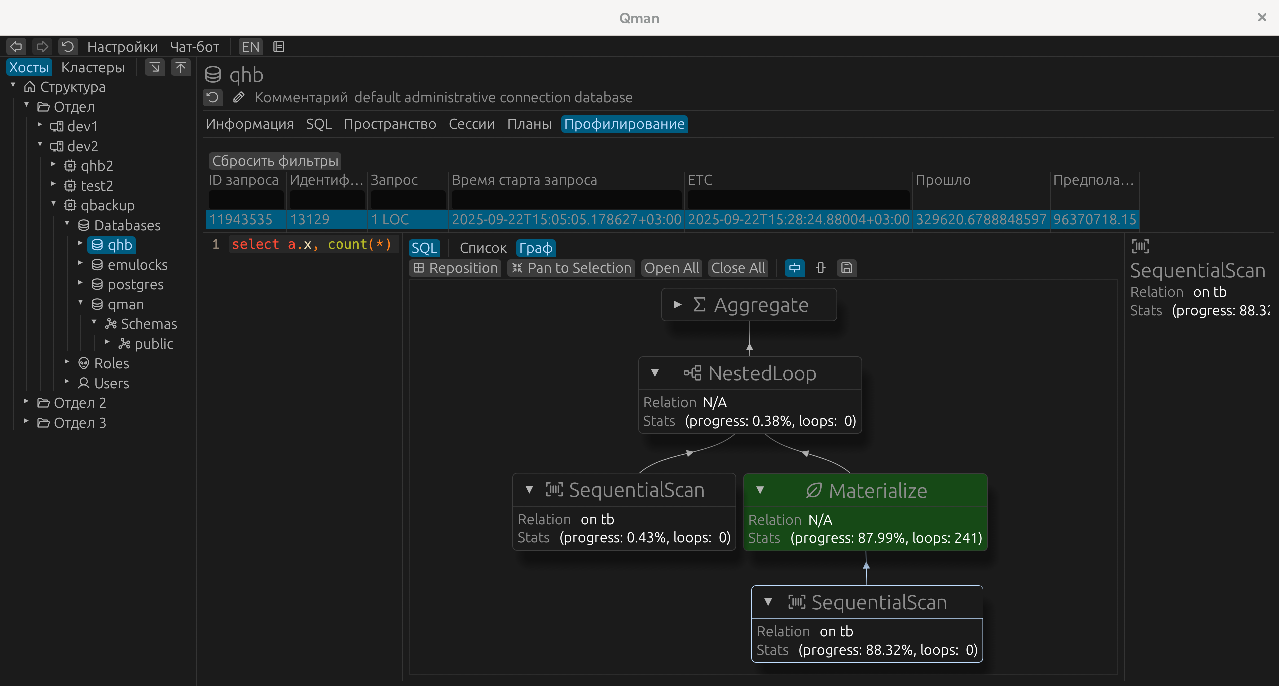
Profiling
Using the "Profiling" tab, you can track a list of running long queries, get a plan for their execution, and see the completion percentage of each step in the plan. To update the plan data, simply click on the corresponding query's row in the query list. There is no need to refresh the entire query list itself.
Figure 27. Profiling Long Queries
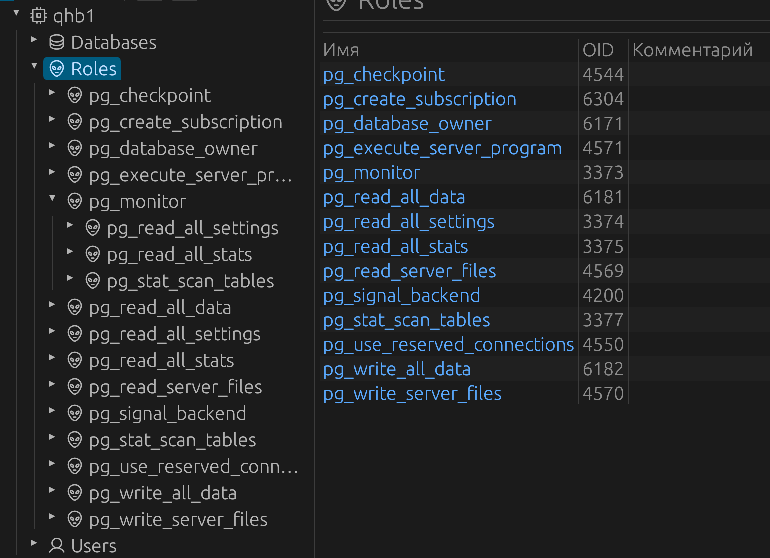
Roles
Roles and users are separated. A list of roles that do not have database connection permissions is contained in the Roles section.
Figure 28. Roles
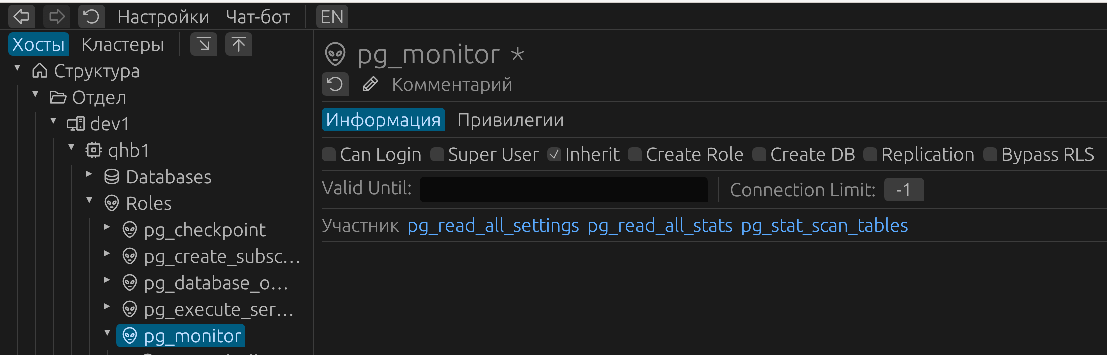
Standard role attributes are presented in the role panel:
Figure 29. Role Information
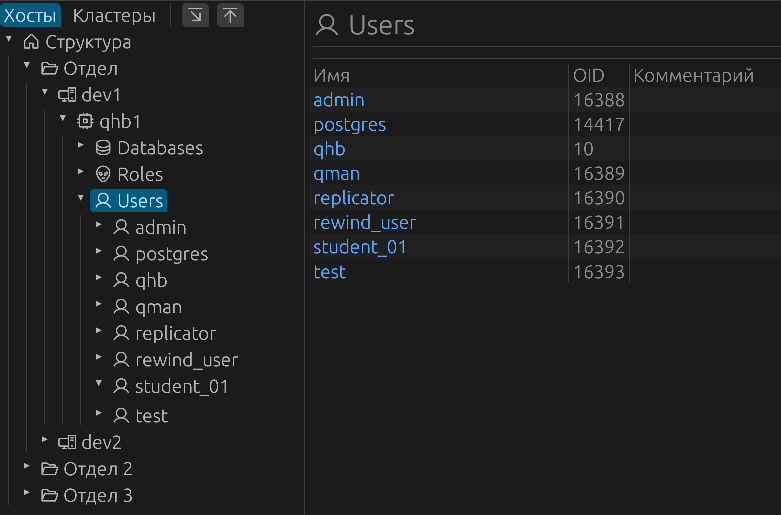
Users
Список ролей без права подключения к базам содержится в разделе Users.
Figure 30. Users
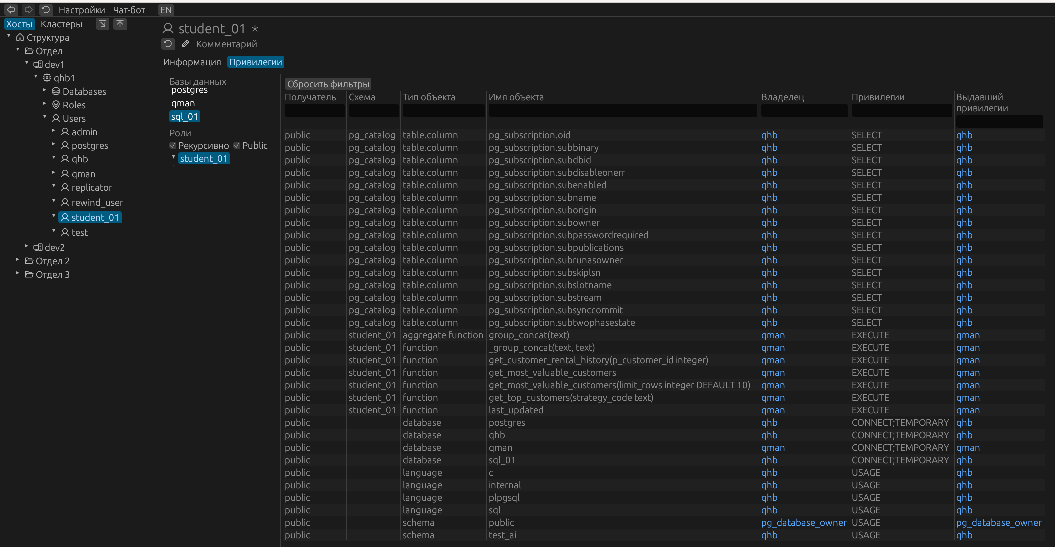
The feature for viewing all roles and individual privileges assigned to a user, including those assigned to the public role, works the same for both roles and users. You can view the privileges assigned to a specific role or view the entire list of privileges, which is generated recursively, taking into account the entire tree of nested roles. You can choose to display or not display the permissions granted to the public role. You can also view this data by selecting a specific database from the general list. Filter fields allow you to display only the data you're interested in.
Figure 31. Privileges
Using an AI Chatbot
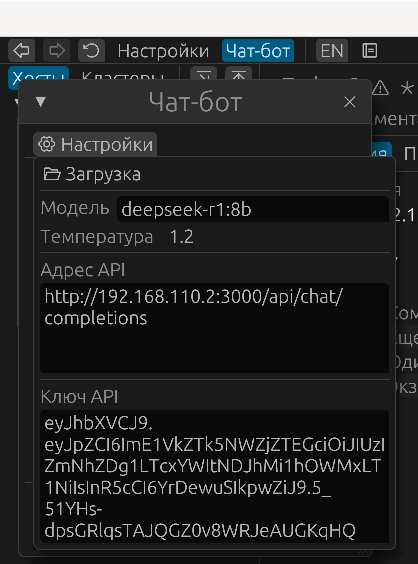
QMAN can use artificial intelligence capabilities, specifically the DeepSeek system. To do this, you should set the corresponding parameters of the chatbot section in the qman_config.toml configuration file: model, url, key, temperature. A value of 1.2 in the DeepSeek3 configuration example, for example, corresponds to high creativity, resulting in varied responses, but may be less accurate. Other models may have different ranges and characteristics. You need to verify the value based on the documentation for the version you are using. The values specified in the configuration are loaded from a file and are visible in the setting window of the chatbot.
Figure 32. Chatbot Settings
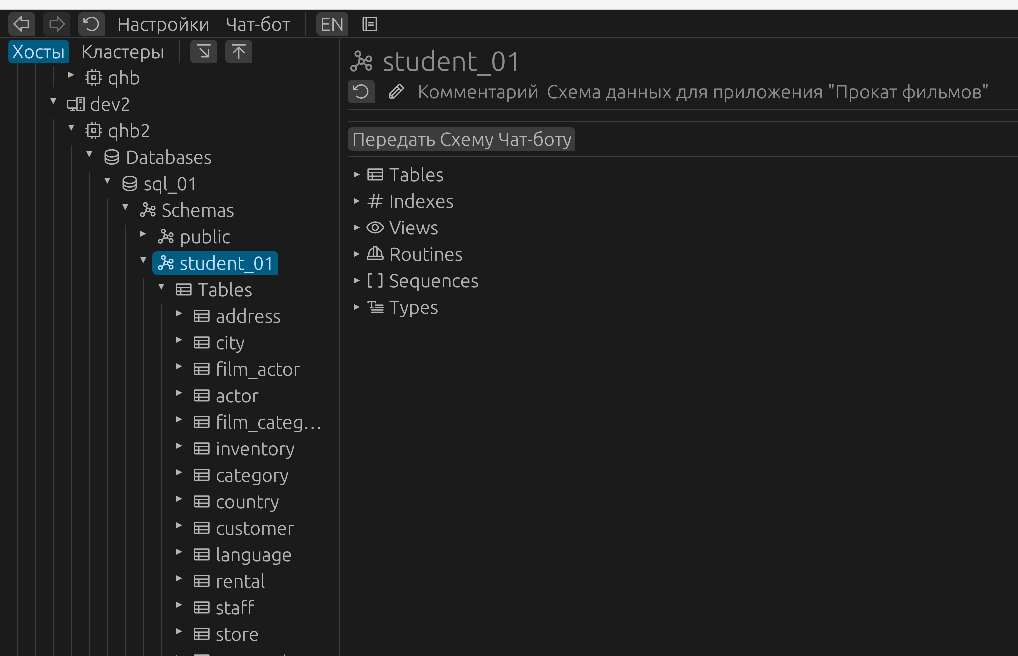
The primary capability of working with AI today is to provide a formalized description of the selected database schema so that queries can be described in native language and then received in a dialog mode formulated in SQL. A database schema description contains a list of all the main database object types existing in the specified schema, including comments on them. The description is provided in JSON format. This allows for a highly structured schema description and allows for combining the formal description of objects with comments on these objects in the native language, which is a very efficient approach. This significantly increases the accuracy of responses. The request for obtaining a description of the schema passed as a parameter is located in the qman-backend/data/tpl/sql/schema_objects.tpl template. To initiate a chat with the AI, you can use the "Pass schema to the chatbot" button when navigating to the schema name you are interested in.
Figure 33. Starting to Use the Chatbot
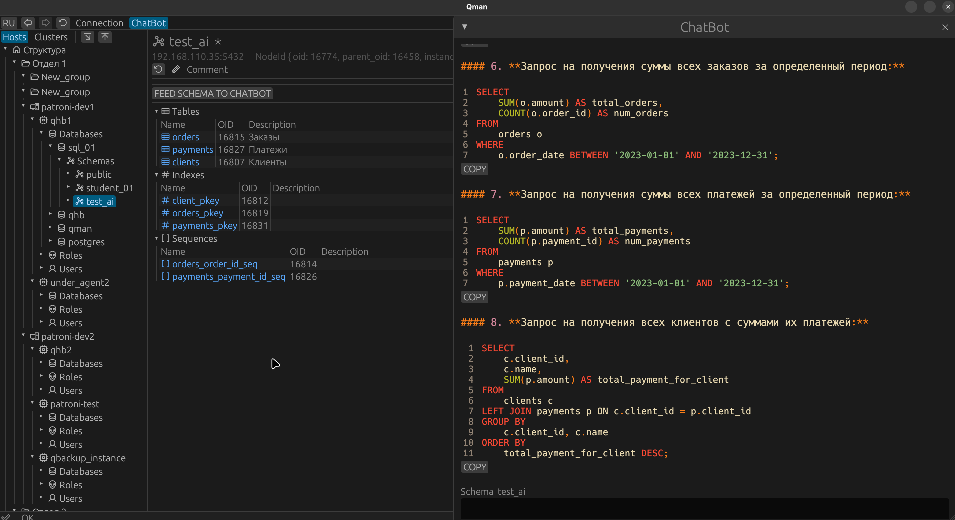
The user can then set any direction for the conversation. Currently, there is no automatically generated starting message. After providing the schema description, the user can request SQL queries that meet the user's needs. Chat usage example:
Figure 34. Chatbot Responses
Also, the AI chat window can be called independently from the "Chatbot" main menu item.
Cluster Information
Switching to the Cluster Data View
To display cluster information, you must switch to cluster view mode in the object tree menu using the "Clusters" button. This mode displays information only on active clusters, along with a list of the nodes within each cluster. Depending on the cluster type — Patroni or Qluster — the corresponding information is displayed.
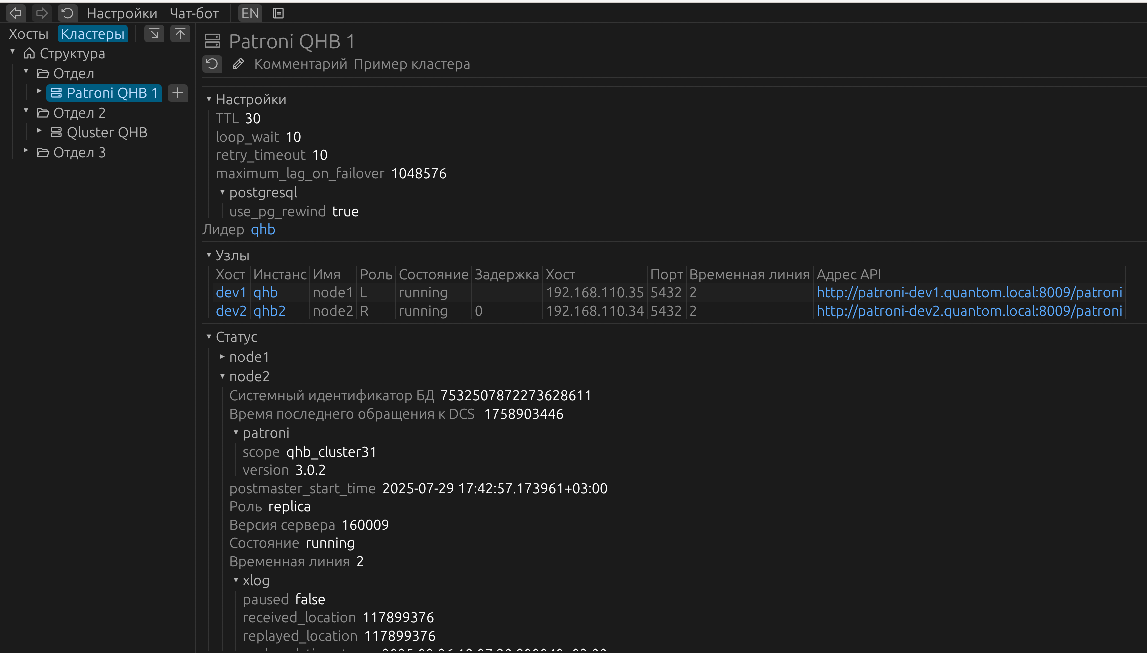
Patroni Clusters in QMAN
Currently, QMAN does not support managing Patroni clusters. Only basic data is displayed:
- configuration parameters;
- cluster structure;
- status of its nodes.
Figure 35. Patroni Cluster
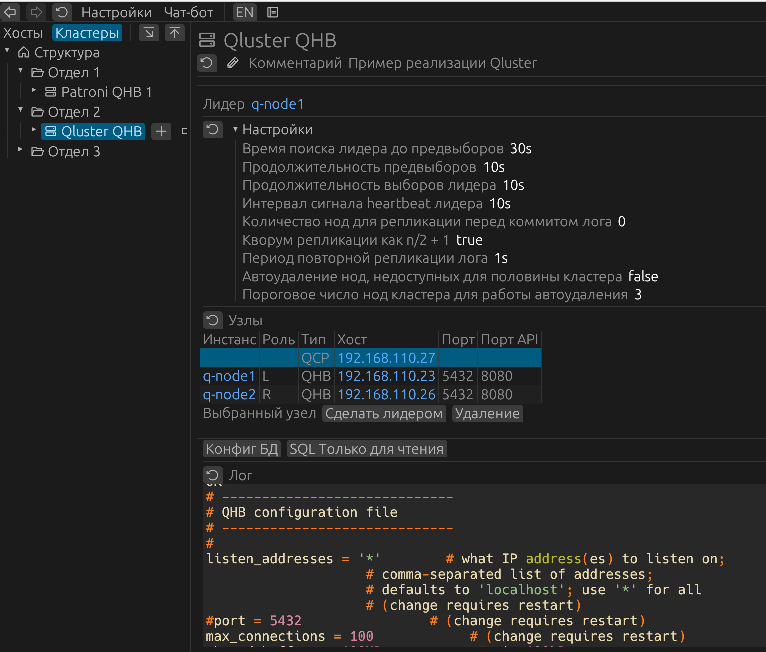
Qluster Clusters in QMAN
When navigating to a cluster of type "Qluster", the following data is displayed:
- Qluster configuration parameters;
- list of cluster nodes, their role (L — primary, R — standby), type (QHB or QCP), QHB port, and API port;
- control components;
- "Log" field with command results.
Control components:
- the "Make Leader" button switches the cluster leader to the selected node of a cluster with the "QHB" type;
- the "Delete" button removes the node from the cluster. The qluster service is stopped;
- the "DB Config" button displays the QHB settings in the "Log" field;
- the "Read-only SQL" button displays a list of read-only query IDs in the "Log" field.
Figure 36. Qluster Cluster